# :diamond_shape_with_a_dot_inside: 2.3.E. Analysis at graph level
If a back-and-forth between the term list and the map visualization is necessary to finally refine the list of candidate terms, the last part of the analysis consists of explaining the maps obtained after this iterative work.
Gargantext offers you two graphs, so it's up to you to decide which one speaks to you most:
- the 1st-order graph (called syntagmatic) = groups together terms that are mentioned together in a text. So the clusters formed are sets of terms that are closely related to each other. This interaction between terms highlights community usages (in other words, communities of practice).
- the 2nd-order graph (paradigmatic) = groups terms by more structural similarity, i.e. terms are brought together because they have a similar profile, highlighting major categories. This map is therefore richer in links between terms.
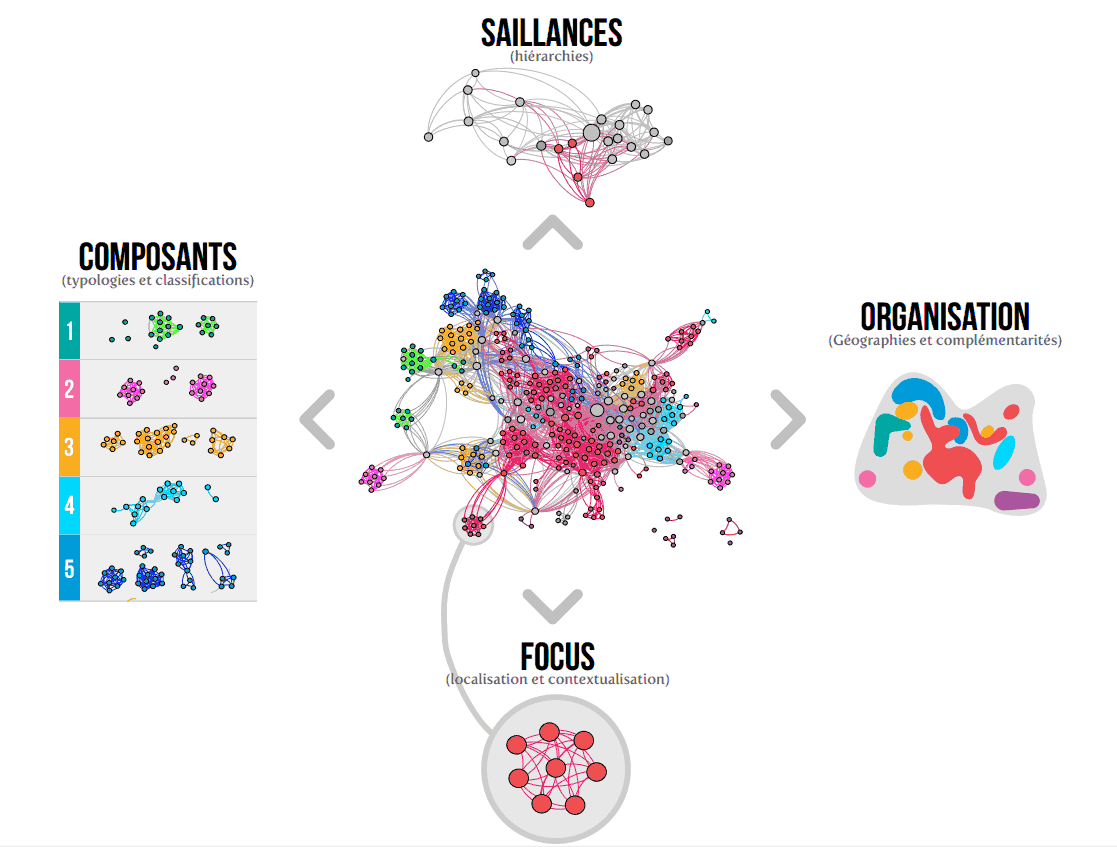
The diagram below gives you a few analysis keys to help you think about the comments to make on your map:
>Source: https://ateliercartographie.wordpress.com/2013/07/30/expedition-cartographique-dans-lunivers-des-brevets/ [name=L'Atelier de cartographie] [time=Mon, Jul 30, 2013] [color=#327AB7]
## Components
The first element of analysis concerns components or clusters: Gargantext isolates in distinctly colored sub-graphs the various subsets of documents sharing the same terms in the corpus. The aim is to explain them and detail the terms that make them up.
## Organization
The second element of analysis is to understand the organization and positioning of clusters. As a reminder, the clusters at the center of the graph are the most generic, while the more specific ones are peripheral. It's also a question of explaining, based on your knowledge of the research subject, why such and such a cluster is on the periphery.
## Focus
The third element of focus analysis is a corollary to the second, since you need to be able to enter the clusters to analyze the terms.
## Salience
Finally, the fourth element of analysis concerns the detection of protrusions, i.e. elements in the graph that link two clusters, for example, or that are completely isolated. Their analysis will reveal new, atypical information that is worth exploiting.